
Q1 2021 Migration Trends: Outflows from New York and San Francisco Start to Slow, Signaling a Mild Recovery

Today, we released our United States Migration Report for the first quarter of 2021, highlighting key trends in consumer migration patterns as the COVID-19 pandemic has persisted. The report reflects an analysis of approximately 300,000 moves, revealing which states and metropolitan statistical areas (MSAs) had the highest percentages of inbound and outbound moves.
Notably, Updater found that outflows from dense urban cities such as New York, San Francisco, and Boston have started to slow. This potentially signals the start of a mild recovery for cities that had lost record numbers of residents in 2020 due to high costs of living, density concerns, and the closure of entertainment, dining, and lifestyle amenities that typically keep people in these locations. Updater’s predictive data suggests that more people expect to migrate back to these destinations in Q2, further shrinking their net losses.
It’s been fascinating to watch migration trends shift away from cities and to warmer weather climates during the pandemic,” said David Greenberg, Founder and Chief Executive Officer of Updater. “With vaccinations underway, restrictions lifting in some of our hardest-hit cities, and companies rolling out permanent hybrid working solutions, we’re anticipating a summer moving season unlike any other with a series of new, atypical patterns.”
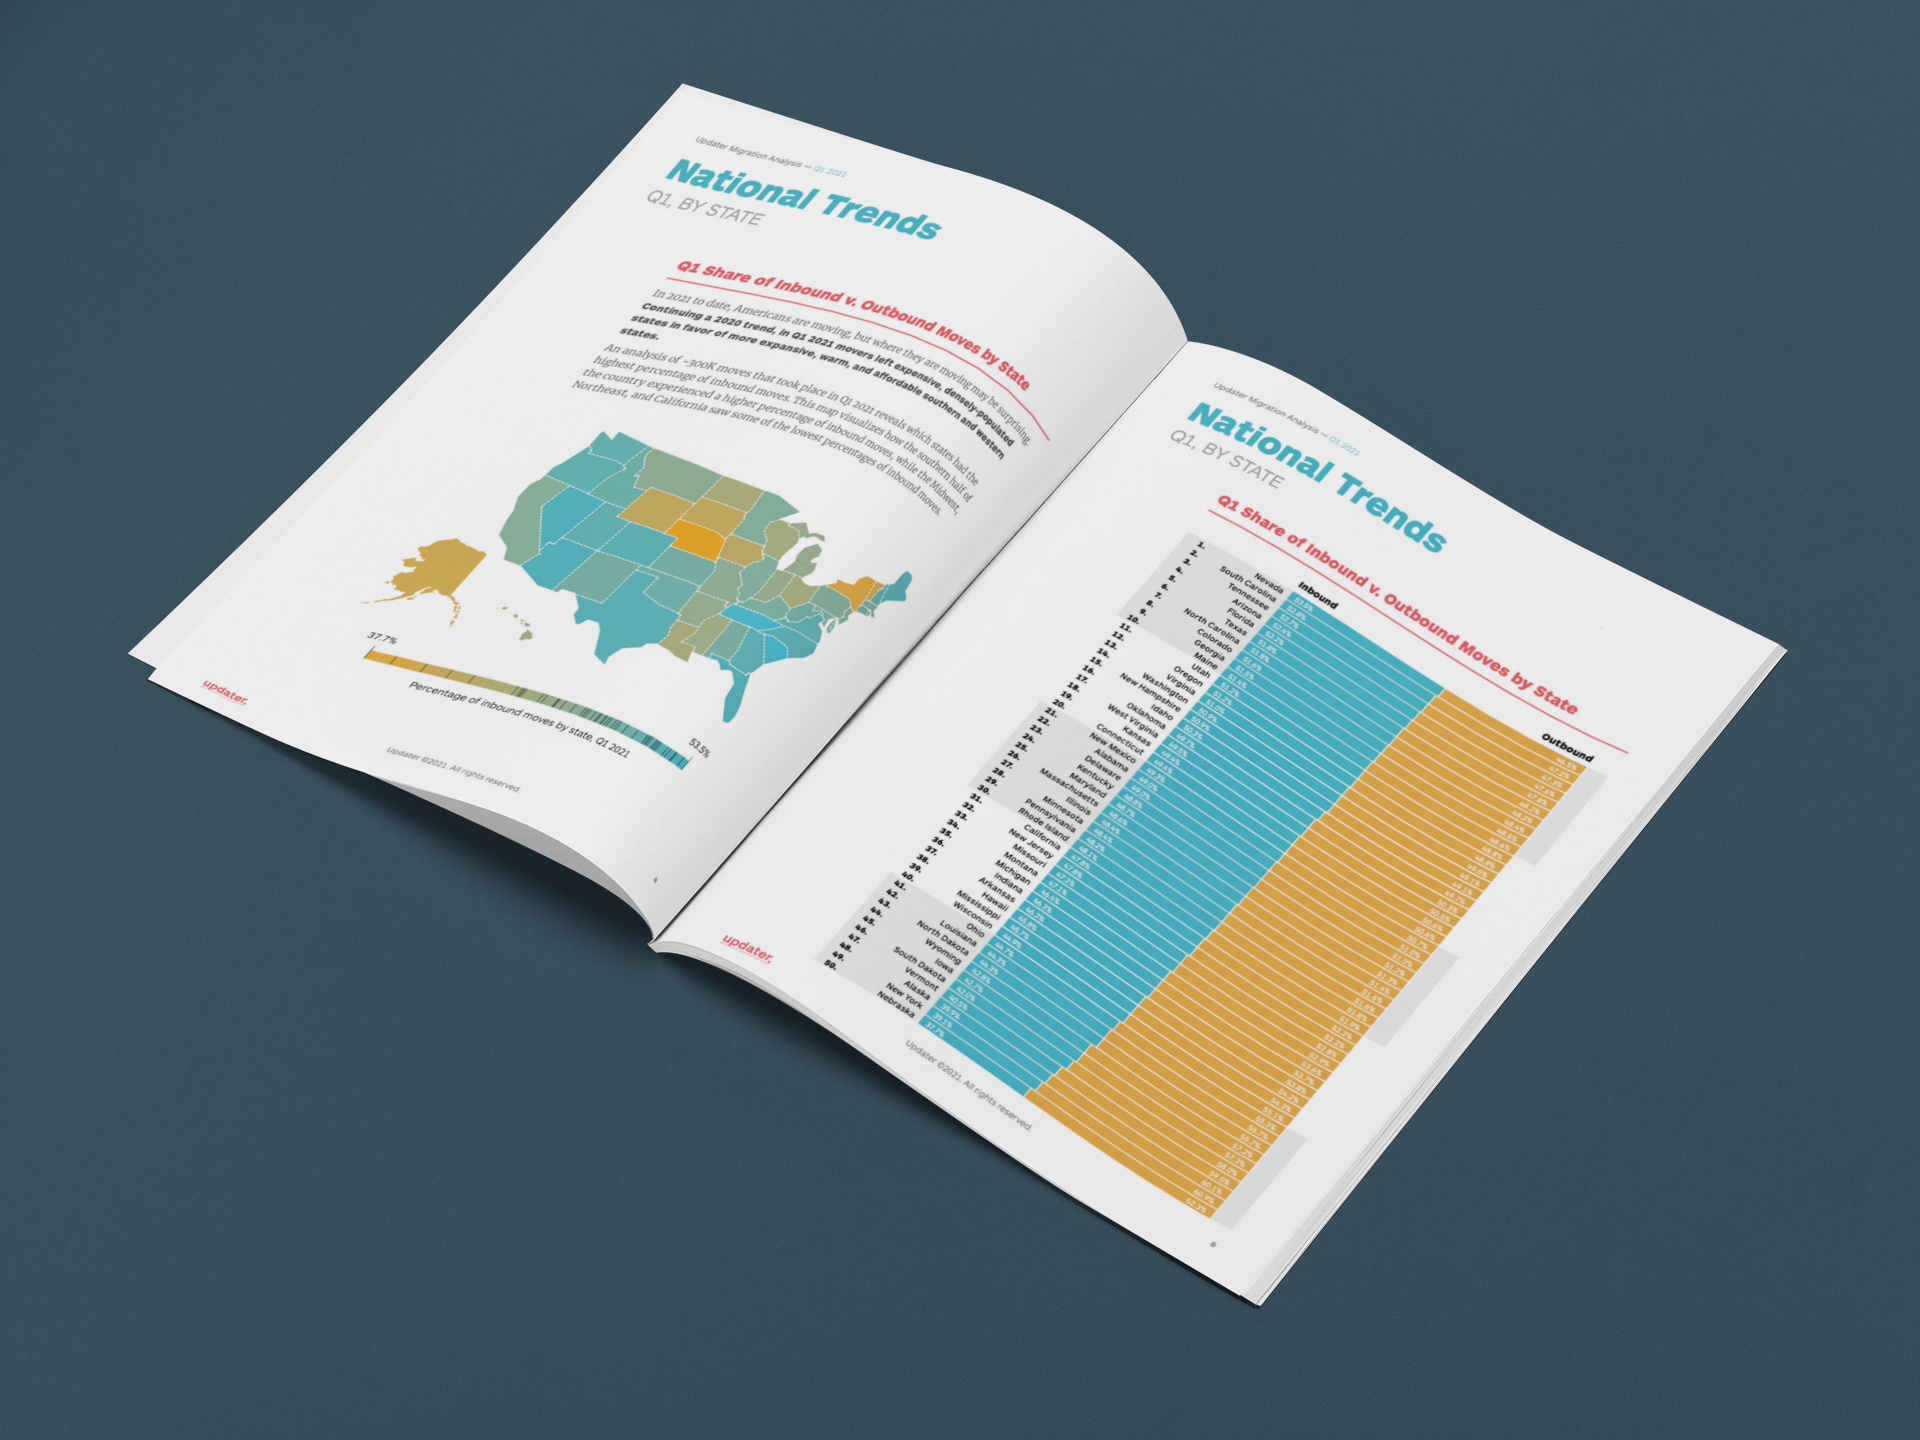
Q1 saw a continuation of the migration trends Updater noted in 2020, where the vast majority of movers left expensive, densely populated states in favor of more expansive, warm, and affordable southern and western states. In fact, only 16 states in the US had a greater percentage of inbound moves than outbound moves, including nine warm-weather states, four of which – Florida, Nevada, Tennessee, and Texas – don’t charge income tax. Of the 16 states, six are in the western half of the country. Maine and New Hampshire are the only states from the Northeast to see more inbound than outbound moves.

Focusing in on MSAs, seven in Florida — Fort Myers (#1), Sarasota (#5), Tampa (#11), West Palm Beach (#12), Lakeland (#13), Jacksonville (#16) and Melbourne (#20) – made the top 20 inbound cities for Q1, up from four a year ago. The top three cities on the list, indexed by population, were Fort Myers; Savannah, Georgia; and Austin, Texas. Savannah (#2) saw the biggest jump in ranking year-over-year, having ranked 32 in Q1 2020. Moreover, Odessa, Texas, entered the ranking for the first time at no. 8. Cities that dropped in rank year-over-year, including Nashville, Raleigh and Phoenix, will be interesting to watch for a potential rebound in 2021.
Looking at outbound moves, Nebraska saw the largest percentage of movers leaving, followed by New York, Alaska, Vermont and South Dakota. When it comes to MSAs, Milwaukee, Cleveland, New York, St. Louis and Colorado Springs saw the most outbound moves, with Colorado Springs seeing the biggest jump – 20 points – year-over-year. Interestingly, half of the cities with the highest percentages of outbound movers are located in the Midwest.
Updater’s migration report is different from traditional inbound and outbound migration studies, which do not provide clear insight into current patterns because, inevitably, the most populated cities will be at the top of the list from a volume perspective. Updater’s model for assessing the top MSAs addresses the challenges of other inbound and outbound migration studies by indexing cities according to population and computing results accordingly.
Moreover, Updater’s data is unique in that it comprises fully-verified movers. This eliminates outdated and inaccurate statistics that occur when tabulating mail forwarding forms, which by definition are not real-time, and exclude moves that are not designated as permanent. Updater data also comprises deeper and richer data points, including homeownership vs. renting, move distance, mover demographics and psychographics, move timing, and more. Updater also captures this information on average 66 days prior to a move, meaning its data can be used to predict with greater accuracy where people are migrating to the United States.
To download a full copy of the report, click here.